
![]() Several Brazilian rainforests have probably been pulped in the amount of written material devoted to the subject of using the past performance of a horse to predict today’s expected performance. Don Scott, recognised as the Father of Ratings, led the punting revolution with his idea of only betting when the odds available were in your favour. Punters now refer to this concept as an overlay. Overlays are widely accepted as the way to go if you are serious about your punting. In Don’s 1982 book “The Winning Way” the mantra YOU CAN ONLY WIN WHEN THE ODDS ARE IN YOUR FAVOUR is repeated again and again.
Several Brazilian rainforests have probably been pulped in the amount of written material devoted to the subject of using the past performance of a horse to predict today’s expected performance. Don Scott, recognised as the Father of Ratings, led the punting revolution with his idea of only betting when the odds available were in your favour. Punters now refer to this concept as an overlay. Overlays are widely accepted as the way to go if you are serious about your punting. In Don’s 1982 book “The Winning Way” the mantra YOU CAN ONLY WIN WHEN THE ODDS ARE IN YOUR FAVOUR is repeated again and again.
So how do you know when the odds are in your favour?
Don doesn’t really help us much. In “The Winning Way” most of the material is devoted to how you should go about determining accurate ratings for each horse. Little time is spent on how you should then convert these ratings into odds. Don devotes just 6 of 438 pages to this topic – only 1.5% of the total book. Surely the true worth of your ratings cannot be realised until all the information you have obtained in doing the ratings is faithfully reflected in the final output – the required odds.
From personal experience I know that if the method you use to convert ratings to odds is not accurate and your top pick has the highest strike rate you end up just betting on your top pick most of the time, irrespective of whether it is an overlay. You con yourself into thinking that it must be the best bet because it is your top rated selection … but all you have done is ignore Don’s mantra. The odds are definitely not in your favour.
And don’t you think it’s a bit of a waste, that all your ratings work is reduced into just one single number upon which the assessed price is solely based. This single-point value has to encapsulate the most likely performance expected of this horse. But in reality every horse has its own range of performance ratings – from poor to outstanding – any one of which may occur today. Why reduce all this information into one single-point rating when there is a method available which uses the full range of the horse’s performance ratings for calculating odds.
A Two-Horse Race
The easiest way to start is to consider a two-horse race between horses A and B which is run again and again. Let’s assume that A and B have the following range of ratings, and that each rating is equally likely to occur:
- A has ratings of 51, 52, 53, 59, 60, 61 for an average of 56.0
- B has ratings of 50, 51, 57, 58, 58, 59 for an average of 55.5
In this head-to-head race let’s look at what happens if A performs a rating of 51. For A to win, B has to perform at its lowest rating of 50 which happens once in every 6 races. If B performs at 51 then the race will be a dead-heat and so we can ignore it.
We then continue on looking at each of A’s ratings in turn and come up with the following table :
A wins 22 times. We then repeat the same exercise with B.
B wins 12 times. Hence, if this race was run 36 times, A wins 22 times, B wins 12 times and there would be two dead heats. The True Odds can then be calculated as shown in Figure 1. There are other methods that can be used for Odds calculation. One simple method (attributed to Benford of Benford’s Law fame) assigns points to the horse’s ranking. The Benford odds for the A v B race is also shown in Figure 1 below :
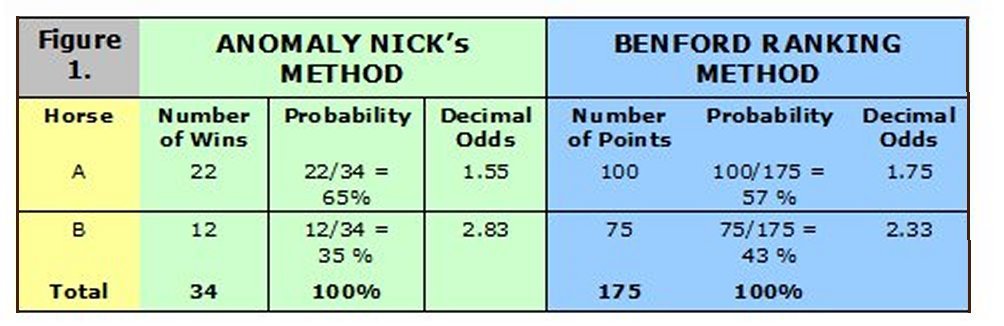
You may then think … so what ! They give roughly the same answer so why not use the less complicated Benford approach. But stay with me … I am sure you will find the final conclusion quite astounding.
Let’s add another horse C and consider a two-horse race between B and C who have the following range of ratings …
- B has ratings of 50, 51, 57, 58, 58, 59 for an average of 55.5
- C has ratings of 55, 55, 56, 56, 57, 57 for an average of 56
Let’s look at what happens when we compare the 36 possible combinations.
The B v C tables are as follows :
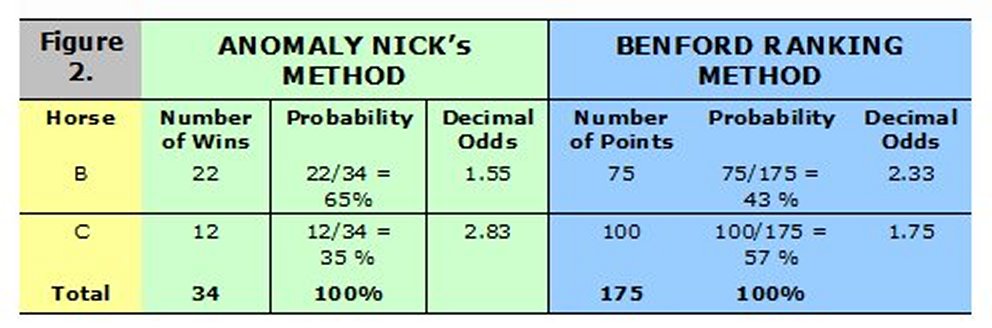
If this race was run 36 times, B wins 22 times, C wins 12 times and there would be 2 dead heats. So B will beat C in the ratio 65% to 35% . But if you use Average Ratings and apply the Benford method, C is the favourite over B … which is incorrect. Please refer to Figure 2 for the exact calculations.
Now let’s add another horse D and consider a two-horse race between C and D with the following ratings …
- C has ratings of 55, 55, 56, 56, 57, 57 for an average of 56
- D has ratings of 53, 54, 54, 55, 61, 62 for an average of 56.5
It can be shown that the same odds apply as for B v C with C beating D in the ratio 65% to 35% and again the order of the Average Ratings is reversed.
But what happens if there is a two horse race between A and D. We have already established that A will beat B who will beat C who will beat D so surely A would beat D ? … well maybe not …
Let’s look at the comparison tables :
So surprisingly D will beat A in the ratio 65% to 35% and this time the Average Ratings correctly predicts the favourite.
Are you a little surprised or even shocked ! I know I was when I first discovered it . It certainly flies in the face of using indirect performance comparisons between horses. Everyone assumes if A beats B beats C beats D then A will beat D … but this is not always the case. This apparent paradox was first highlighted by Bradley Efron a Stanford University statistician who designed Efron Dice to dramatise the difference between transitive and non-transitive relationships.
If you want to know more about Efron Dice then go to my article on Efron Dice and Non-Transitive relationships (Sorry , not there yet. Coming soon)
Calculating Odds for races with many runners
The next step is to extend this concept to calculate the odds in races with more than 2 runners. The concept is simple … for any horse to win the race he has to produce a rating that is better than all the other runners in this race.
Let’s consider a four horse race between A, B, C and D who have the same ratings as mentioned previously …
- A has ratings of 51, 52, 53, 59, 60, 61 for an average of 56.0
- B has ratings of 50, 51, 57, 58, 58, 59 for an average of 55.5
- C has ratings of 55, 55, 56, 56, 57, 57 for an average of 56
- D has ratings of 53, 54, 54, 55, 61, 62 for an average of 56.5
The worksheet used to calculate odds under my method for the four horse race is shown in Figure 3.
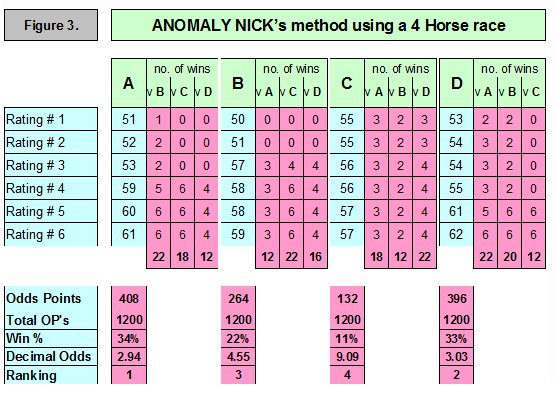
Let’s look at A. The numbers below the “ v B v C v D” columns represent the number of times that A will beat B, C, D when he performs at each of his rating levels. For example, if A does a 59 rating he will beat B 5 times, C 6 times and D 4 times. The Odds Points (OPs) are then calculated as the sum of the products of these figures and the required odds can then be calculated from these OPs. For example, in every 1296 races ( that’s 6 x 6 x 6 x 6) there will be 96 dead-heats (ignore) and of the remaining 1200 races A should win 408 times giving him a win % of 34% and decimal odds of 2.94. The OPs for B, C and D can be derived in a similar way and then the win % and the decimal odds can be calculated.
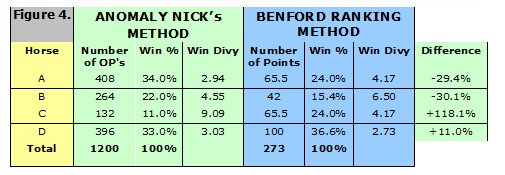
Figure 4 shows a comparison of decimal odds calculated using the two methods. As you can see there is a significant variation between using a single value Benford ranking and using the whole set of ratings under my approach. Except for D (11%) the percentage difference is around 30% for A and B, but over 100% for C.
Conclusion : Whilst ratings are important in assessing the LIKELY WINNER, it is the calculation of the correct ODDS which will determine the PROFITABILITY of your system.
Note : I have developed a generalised algorithm which converts a set of ratings to odds using the above methodology. A minimum of 6 ratings per runner is recommended. If you are interested in using my Paradox Of Odds algorithm to convert your ratings to odds then please leave me a comment below and I would be happy to quote you for this work.
2 Responses to Paradox of Odds